Regional Variations in Mobile Gaming Adoption Across US Cities and Age Demographics
Avery Schmitt · May 23, 2026
Regional Variations in Mobile Gaming Adoption Across US Cities and Age Demographics
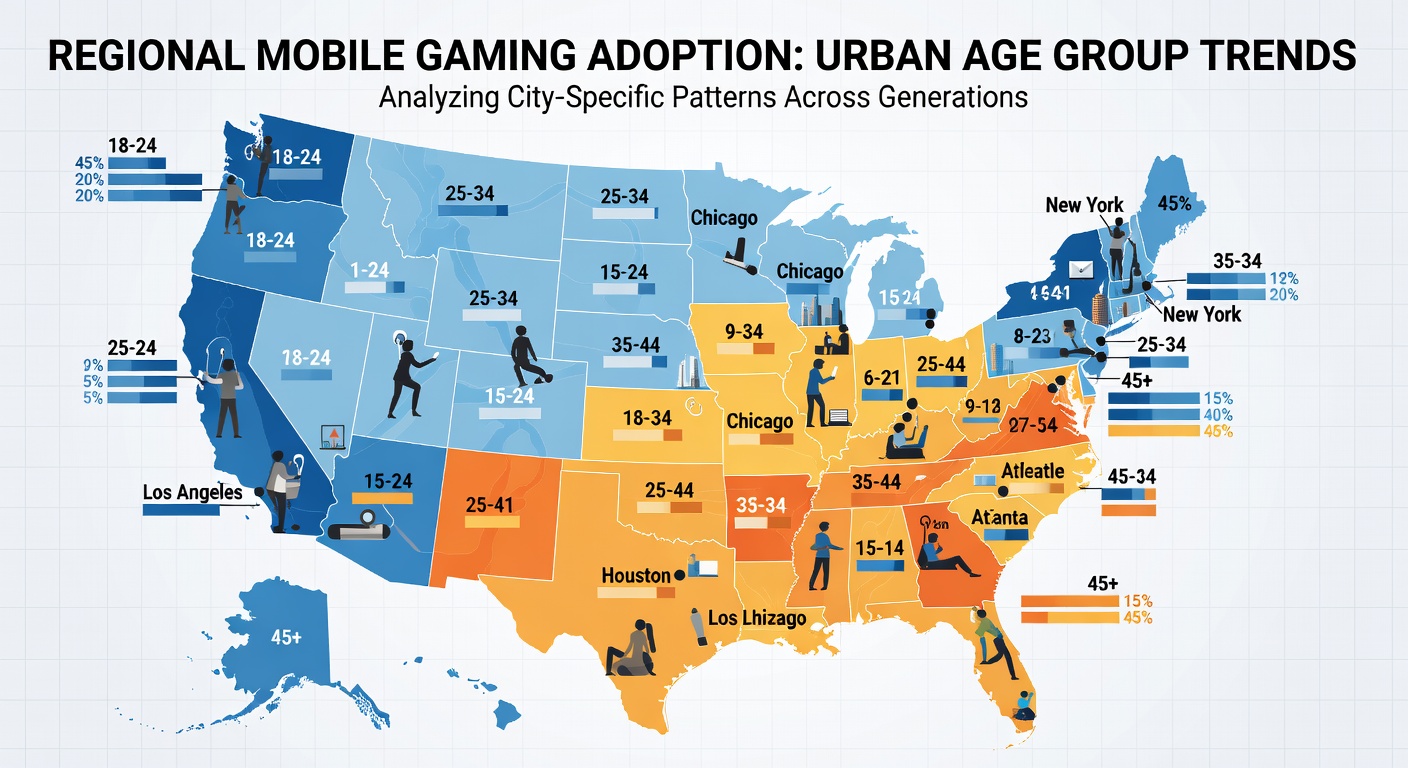
Data from multiple metropolitan surveys conducted through early 2026 reveals distinct patterns in mobile gaming adoption that differ sharply by region and age cohort, with coastal hubs showing elevated engagement among younger users while midwestern and southern cities display steadier uptake across broader demographics. Researchers tracking usage metrics note that these differences align with variations in broadband infrastructure, smartphone penetration, and local entertainment preferences, creating a patchwork of adoption behaviors that analysts continue to monitor as new titles and platforms emerge.
National Baseline and Shifts Observed by May 2026
Industry reports compiled by the Entertainment Software Association indicate that overall mobile gaming participation in the United States reached approximately 68 percent of smartphone owners aged 18 and older by spring 2026, yet this aggregate figure masks pronounced geographic and generational splits. Adoption rates climb fastest among adults between 18 and 34 in dense urban corridors, whereas participation among those 55 and older remains more consistent regardless of location. Studies from university research teams further document that daily play sessions average longer in cities with extensive public transit networks, where commuters frequently turn to mobile titles during travel.
Coastal Cities Lead in Younger Demographics
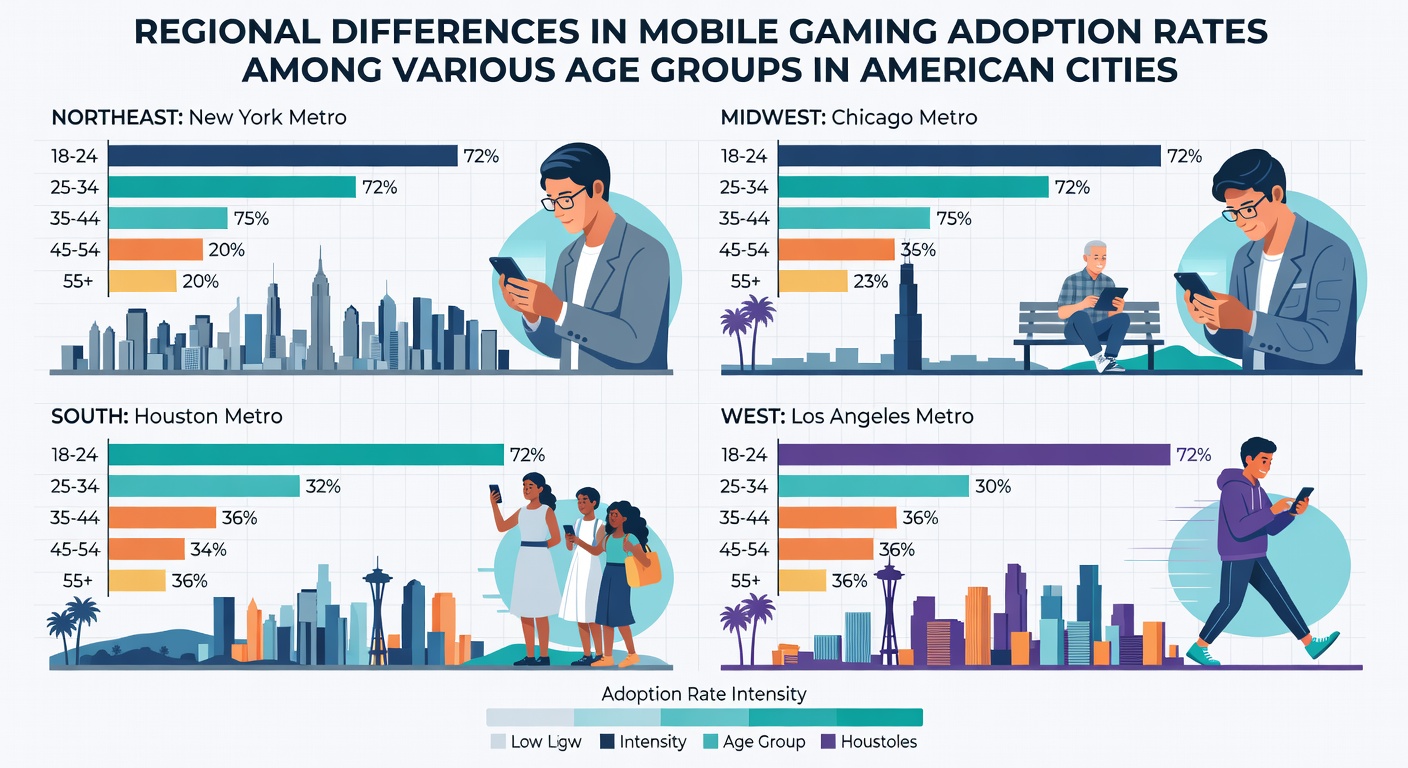
Los Angeles and New York City continue to post the highest adoption figures for users aged 18 to 24, with local data sets showing over 85 percent engagement in these groups according to aggregated app analytics. Seattle and San Francisco follow closely, where tech-savvy populations and widespread 5G coverage support rapid uptake of new mobile releases. In contrast, the same age bracket in Atlanta and Dallas registers adoption closer to 72 percent, suggesting that regional economic factors and competing outdoor activities influence how younger residents allocate leisure time. Observers note that these coastal concentrations often coincide with higher concentrations of game development studios, which in turn seed local communities with early access to beta tests and promotional events.
Midwest and South Show Steady Cross-Age Patterns
Chicago and Minneapolis exhibit more balanced adoption across age ranges, with participation among 35 to 54 year olds nearly matching that of younger cohorts at around 65 percent. Data indicates that family-oriented titles and puzzle games drive much of this parity, particularly in households where multiple generations share devices. Southern cities such as Houston and Charlotte display similar leveling, although rates among adults over 55 dip slightly below national averages in these markets. Analysts attribute the steadier distribution to robust community gaming events and established local esports scenes that draw participants of all ages rather than concentrating appeal among youth.
Age-Specific Trends Across Regions
Breakdowns by decade reveal that 25 to 34 year olds in western cities maintain the longest average session times, often exceeding 90 minutes daily during peak periods. Meanwhile, the 45 to 54 cohort shows stronger adoption in northeastern metros, where established professional networks overlap with casual gaming communities. Those 55 and older register the smallest regional variance, with participation hovering between 38 and 45 percent nationwide, although cities with strong retirement populations such as Phoenix and Tampa edge slightly higher. Research teams tracking these metrics emphasize that device affordability and digital literacy programs play larger roles than geography alone for older users.
Factors Driving Geographic Differences
Infrastructure remains a primary variable, as cities with earlier 5G rollouts record faster growth curves among mobile-first users. Economic indicators also correlate with adoption, since regions experiencing job growth in creative sectors tend to attract younger professionals who integrate gaming into social routines. Cultural elements surface in the data as well, with certain mid-sized cities in the Pacific Northwest demonstrating elevated interest in indie mobile titles compared to larger markets that favor mainstream franchises. Reports from academic institutions further highlight how local regulations on app store policies and data privacy can subtly shape which age groups feel comfortable engaging with new platforms.
City-Level Case Examples
Portland and Austin illustrate how lifestyle factors intersect with adoption rates, as both cities post above-average figures for the 25 to 44 age range yet diverge in older demographics. Boston shows elevated participation among students and professionals under 35, while Cleveland maintains consistent engagement across working-age adults through community-organized play sessions. These localized patterns emerge from a combination of available leisure infrastructure, workplace culture, and demographic composition rather than any single dominant influence.
Conclusion
Patterns documented through May 2026 underscore that mobile gaming adoption in American cities reflects an interplay of regional infrastructure, generational preferences, and local economic conditions. Continued data collection by research organizations and industry groups will clarify whether these divides narrow or widen as technology and content evolve, providing clearer benchmarks for developers and city planners alike. Pew Research Center and reports from Statistics Canada offer additional comparative context on North American usage that complements domestic findings.